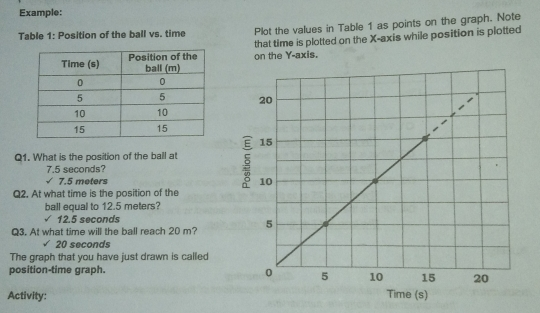
Example: Table 1: Position of the ball vs. time Plot the values in Table 1 as points on the graph. Note that time is plotted on the X-axis while position is plotted on the Y-axis. E Q1. What is the position of the ball at 7.5 seconds? √ 7.5 meters Q2. At what time is the position of the ball equal to 12.5 meters? √12.5 seconds Q3. At what time will the ball reach 20 m? √20 seconds The graph that you have just drawn is called position-time graph. Activity: Time s
Question